My Takeaways from Grafana Con 2026
This year I visited Grafana Con 2026 in Barcelona for the first time, after attending the Grafana Cloud-focused Observability Con in 2025.
The conference primarily focused on new features introduced by the release of the open source Grafana 13, AI Observability features for Grafana Cloud as well as improvements across the broader open source observability ecosystem.
Grafana 13 updates
Grafana Assistant becomes available for Open Source
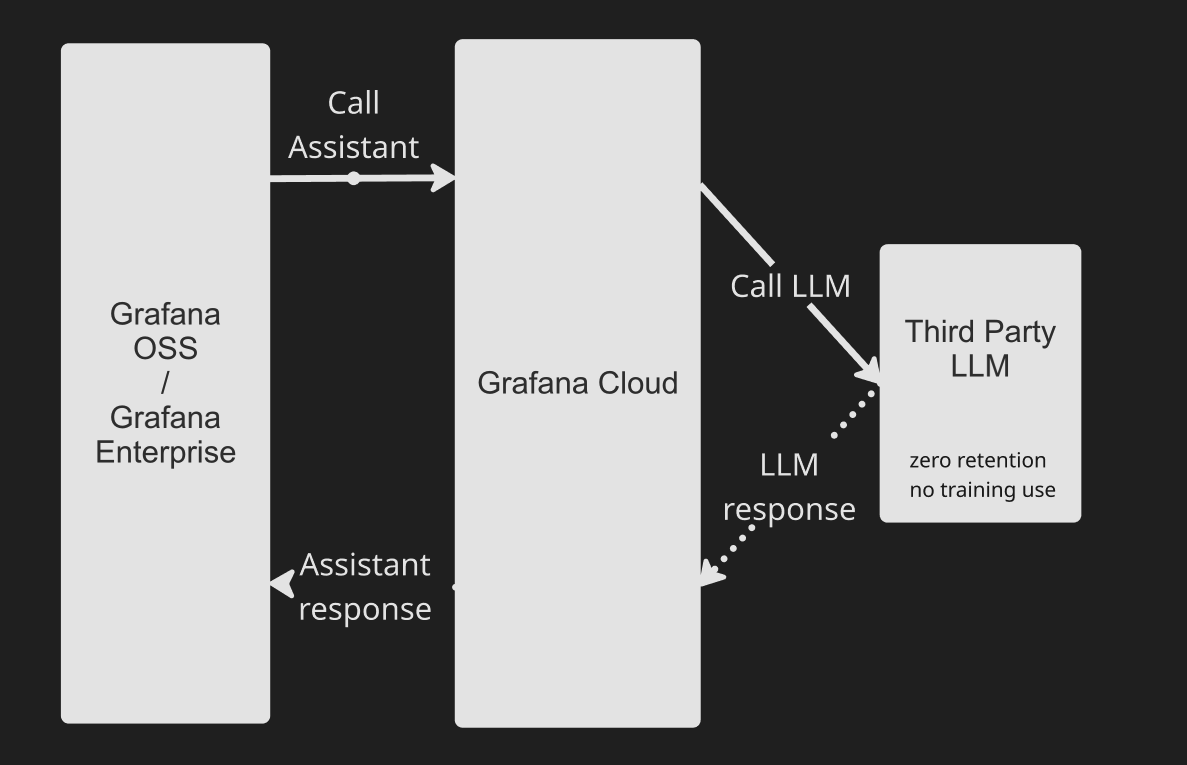
Grafana Assistant, which has been a Grafana Cloud only feature since September 2024, can now also be used with Grafana OSS and Enterprise. The setup requires connecting a Grafana Cloud account, in which the free tier version allows up to 3 monthly active users.
It provides a direct chat integration, allowing users to create and update dashboards and alerts as well as querying data sources and more.
Why it matters: Many development teams struggle with creating dashboards for their own services and dashboard creation and updating becomes an afterthought. From my experience, what's not made visible is often forgotten and almost certainly not alerted upon. The Assistant can lower the barrier to entry significantly.
Caveat: As of May 2026 you can not choose the LLM Grafana Assistant uses or where it's hosted (🇺🇸-only). If you cannot send PII data to the United States, this might be a blocker for you. Alternatively, you can use GCX CLI with your own LLM implementation.
Dynamic dashboards become the standard
Dynamic dashboards, which have been in public preview since January 2026 become GA. All dashboards are migrated automatically.
-
Introduction of Tabs
Tabs are introduced as first level citizens of dashboards. They can be combined with rows up to three levels deep. This allows multiple teams to collaborate on a single dashboard.
This feature lets you put high-level business KPIs on the first tab and underlying system metrics on secondary tabs. Because time range, variables, and filters are shared across all tabs, when a KPI needs attention you can drill into the supporting system metrics without losing context. -
Show / Hide rules
Show / Hide rules allow toggling visibility of a panel based on variables, query results and time range conditions. Useful, if you e.g have services with different architectures that produce different metrics (e.g JVM Heap) or want to differentiate between what is visualised in production and non production environments.
Managing dashboards becomes easier
Grafana emphasises that they want to give developers blueprints they can use to build dashboards so they don't have to start from scratch. With Grafana 13 they announced suggested dashboards, dashboard templates and org templates.
AI Observability updates
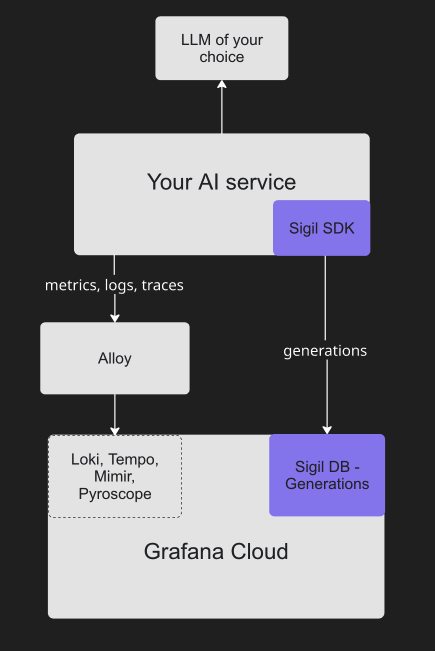
Grafana Cloud tackles its "AI Blind Spot". Until now, teams integrating LLM agents into client-facing applications had to rely on separate tooling like Langchain or Pydantic. They did so by introducing two new pieces to their observability stack:
-
Generations: A new signal, next to the already established Metrics, Logs, Traces and Profiles. Grouped by
conversation, a generation records prompt, response, tokens, latency, cost, and evaluations. Links to existing signals via thetrace_id. -
Sigil: A new Grafana Cloud-only API for storing and querying generations. Has to be called directly via its SDK. Cannot be routed through Alloy or any other OpenTelemetry collector. As of May 2026 closed source.
Opensource ecosystem updates
Open Telemetry going stable
Open Telemetry is aiming at full Cloud Native Graduation. To reach this goal and move from de-facto stable to stable as an entire project their main challenge will be creating a stable release for all their instrumentation libraries.
Loki redesign and performance improvements
Loki announced a rearchitecture delivering up to 20x less data scanned and 10x faster aggregated queries, driven by Kafka as a durability layer, a parallelized query engine, and a new columnar chunk format. With Kafka, logs only need to be written once and effective replication drops to one, compared to 2.3 before. Single-binary deployments remain unaffected and don't introduce Kafka as a dependency. However, distributed setups now require Kafka alongside object storage. Other teams hinted at a similar move in the future, but did not make definite announcements.
Security
Right after its keynote, Grafana presented its recent security incident. The attack vector was a change in their CI which looked harmless (pull_request → pull_request_target) but ultimately allowed the attacker to export all GitHub secrets for the affected Github action workflow.
The Grafana team was then notified hours later by a Canary token which was used by the attacker.
They emphasised using the tooling hackers use against you, yourself against your own code before they do it.
The tooling they recommended for their GitHub Action based setup:
-
Zizmor: A GitHub Actions static analyzer: should run on every CI run. Catches misconfigurations like unpinned actions, dangerous triggers, and injection patterns before they ship.
-
TruffleHog: An open source credential scanner that, among other things, scans git repositories for committed secrets. When it detects a potential secret, it classifies the type (GitHub PAT, AWS key, etc.) and validates it against the issuing provider's API to confirm whether the credential is actually live. I recommend running it in CI on every push and PR, plus a weekly full-history scan.
-
Gato-X: A Github actions scanner that combines capabilities to find and expose vulnerabilities.
- Detection: Covers exposed self-hosted runners, Pwn Requests (workflows that expose secrets by running PR code with privileged triggers like
pull_request_target), and Actions injection (e.g. interpolating untrusted PR input into shell commands:run: echo "PR title: ${{ github.event.pull_request.title }}"). - Attacks: Includes extracting all secrets accessible to a workflow run and the Runner-on-Runner (RoR) technique, which installs a second Actions runner on the compromised self-hosted runner registered to the attacker's GitHub account, giving them persistent interactive access rather than a one-time secret dump.
- Detection: Covers exposed self-hosted runners, Pwn Requests (workflows that expose secrets by running PR code with privileged triggers like
-
Canary Tokens: Canary tokens allow you to plant juicy-looking fake credentials that trigger alerts the moment anyone tries to use them. This is what ultimately notified the Grafana team that they had been compromised and allowed them to act fast.
Does this only affect open source projects?
You might think this is only relevant for open source projects if you work on closed-source code. But any compromised credential with write access (like a leaked PAT, a phished developer account, or a stolen CI token) lets an attacker apply the same pattern inside your private repos. In Grafana's incident, after an initial compromise on their public repo the attacker had gained access to credentials to laterally attack four private repos.
Summary
Overall, I found GrafanaCon to be a well-planned and very informative event. What stood out to me the most were the AI integrations for open source and the AI Observability features introduced for Grafana Cloud. The Ask the Expert booth was the most exciting part of the conference for me and you could clearly feel the excitement of the Grafana staff about their own product.
One more thing worth knowing: Grafana publishes most of its talks roughly a month after the conference, so if you're interested primarily in what's been released, you can follow the Grafana YouTube channel.
References
Grafana: GrafanaCon 2026 announcements, Grafana: Dynamic dashboards is now generally available, Zizmor, TruffleHog, Gato-X, Canary Tokens.